Sales Pipeline Metrics: The Numbers Owner-Led B2B Firms Should Actually Track
Ask an owner-led firm how its pipeline is doing and you get a feeling, not a figure. Here are the sales pipeline metrics that turn gut feel into a picture you can actually act on.
 By Kevin Durkin, Co-Founder, Strategy & AI Quant-Tek.AI
 Ask an owner-led firm how its pipeline is doing and you will usually get a feeling, not a figure. Things feel busy, or they feel slow. That instinct is worth something, but it cannot tell you where deals are stalling, which leads are worth chasing, or whether next quarter will be strong or quiet. Sales pipeline metrics turn that gut feel into a picture you can act on. The good news is you do not need a data team or an expensive tool to start. You need a short list of numbers that tell the truth about how work moves from first contact to a closed deal.
Why owner-led firms fly blind on their pipeline
In a small firm, the pipeline usually lives in the owner's head. They know the big deals by name and can guess at the rest. That works until the firm grows, the owner gets busy, or a strong month is followed by a stretch of silence that no one saw coming. Without sales pipeline metrics, every forecast is a hope and every slow week is a surprise. The point of measurement is not to drown in dashboards. It is to catch problems while they are still small: a stage where deals pile up and stop, a lead source that looks busy but never closes, or a follow-up gap that quietly costs you deals you already paid to generate.
The sales pipeline metrics that actually matter
You can measure almost anything, which is why most tracking efforts collapse under their own weight. Start with a handful of numbers that answer real questions about whether your pipeline is healthy and where it is leaking. These are the ones we watch first for owner-led B2B firms.
- Qualified opportunities: how many real, best-fit deals are in the pipeline right now, not just raw inquiries. This is the single best early warning sign of a slow quarter ahead.
- Conversion rate by stage: the percentage of deals that move from one stage to the next. A stage where the rate drops off a cliff is where your process is quietly failing.
- Average deal size: what a typical closed deal is worth, so you know how many you actually need instead of chasing volume for its own sake.
- Sales cycle length: how long a deal takes to go from first contact to signed. When this stretches, cash and forecasts slip with it.
- Win rate: the share of qualified opportunities that end in a yes. A rising win rate usually means you are talking to better-fit buyers, not just more of them.
- Pipeline value and coverage: the total value of open deals compared with your target, so you know early whether you have enough in play to hit the number.
How to read the numbers together
A single metric in isolation can mislead you. A rising number of opportunities looks great until you notice your win rate is falling, which means you are simply letting in more deals that will never close. A short sales cycle sounds efficient until you see it comes from only ever quoting tiny jobs. The value in pipeline metrics comes from reading them together, as a system. Volume tells you whether enough is coming in. Conversion and win rate tell you whether the pipeline is healthy. Deal size and cycle length tell you whether the deals are worth the effort. Watched together, they point to the one change that will move revenue most this quarter, rather than a dozen that will not.
How to set up sales pipeline metrics without a data team
You do not need new software to begin. You need agreed stages, a place to record deals, and a habit of looking at the numbers on a schedule. Here is a practical order of operations any owner-led firm can put in place this month.
- 1
Define your pipeline stages
Write down the four to six stages a deal actually passes through, from new lead to closed. If everyone names the stages differently, your metrics will never agree. Settle the stages first, in plain language, before you measure anything.
- 2
Pick five metrics to start
Choose a small set, such as qualified opportunities, conversion rate by stage, average deal size, sales cycle length, and win rate. Five honest numbers beat twenty you never look at. You can always add more once the habit sticks.
- 3
Record every deal the same way
Log each opportunity in one shared place, whether that is a CRM or a simple spreadsheet, with its stage, value, and key dates. Consistency matters more than the tool. Metrics built on half-entered data will lie to you.
- 4
Review on a fixed rhythm
Look at the numbers on a set cadence, weekly for the pipeline and monthly for trends. Put it on the calendar so it happens whether or not the week was busy. The review is where metrics turn into decisions.
- 5
Change one thing, then measure again
Use what you see to make a single change, such as tightening qualification or fixing a stalled stage, then watch the metric you expected to move. One deliberate change at a time keeps cause and effect clear.
How this fits the Revenue Architecture System
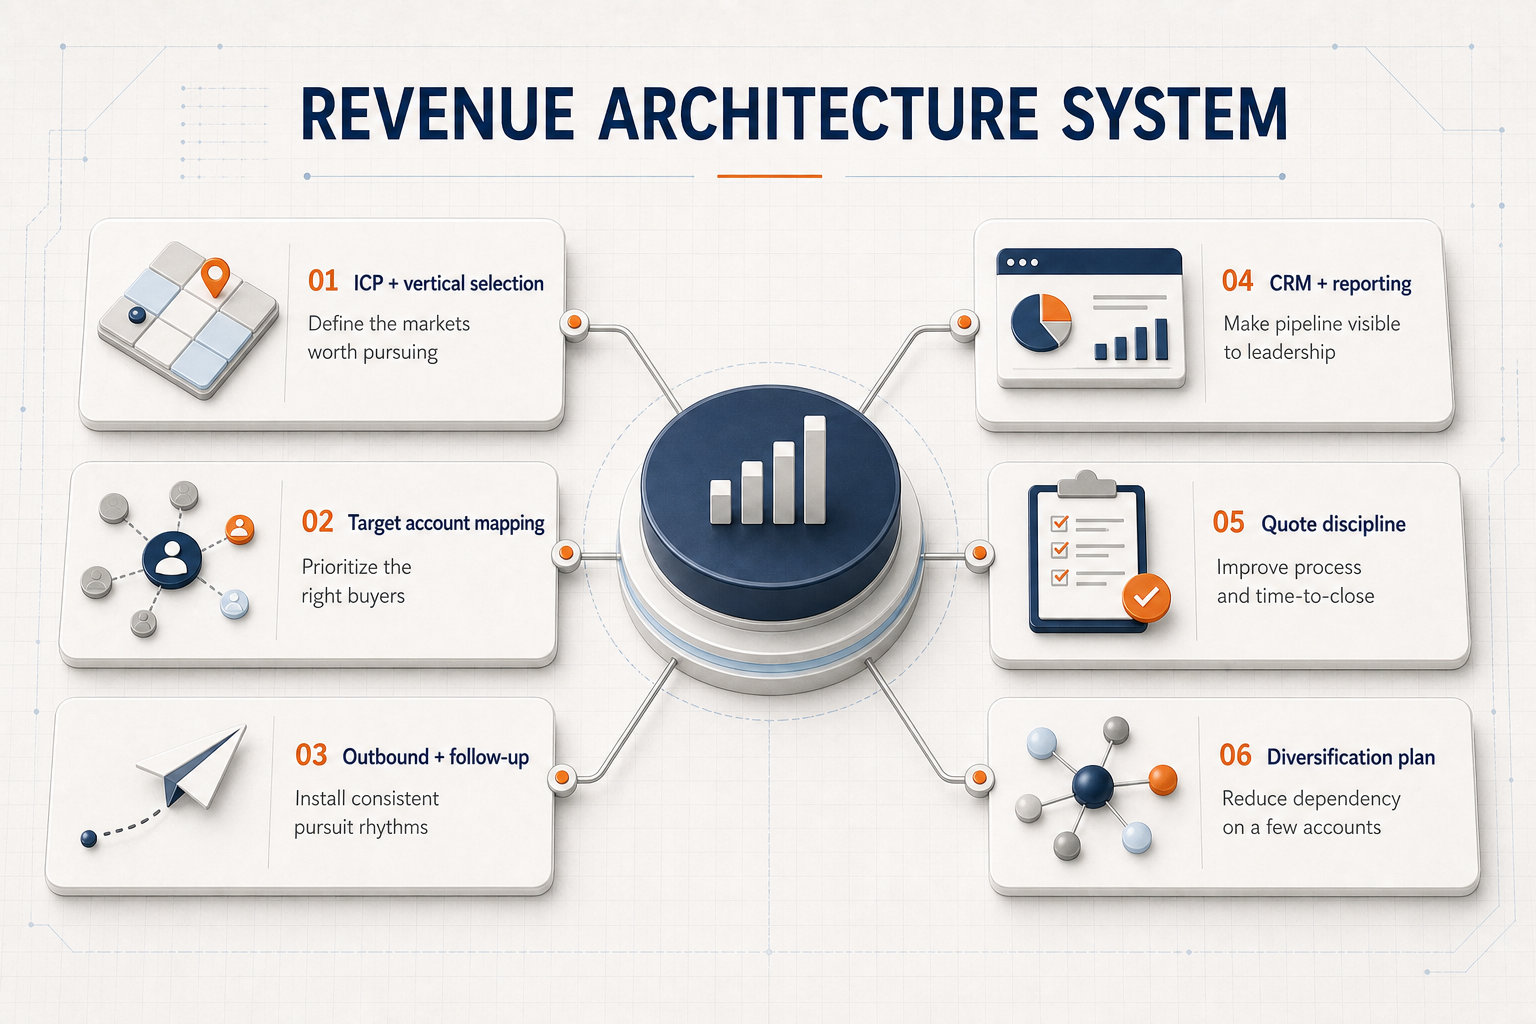
Sales pipeline metrics are not a project you finish. They are the instrument panel for the machine that generates revenue. Getting seen, qualifying leads, and following up all move deals through the pipeline, and metrics tell you whether each part is working. We install the whole thing in a fixed order through the Revenue Architecture System, and measurement is what keeps it honest once it is running. It is also why a predictable sales pipeline and a repeatable sales process reinforce each other: you can only forecast and improve what you consistently measure. You can see how we install the full system end to end.
Where to start
You do not need to overhaul your sales process to begin measuring it. Pick the four to six stages your deals really pass through, choose five metrics, and commit to a weekly look. Within a month you will spot the one stage where deals stall, and that single insight is usually worth more than every report you were not keeping. You can also read more about how we work before you ever talk to us.